Principal Consultant David Nolan reports that it’s a mixed bag from the AEMO Quarterly Energy Dynamics report released this week.
Four times a year, AEMO prepares and releases a report to provide information on Australia’s energy markets to market participants and governments.
Let's start with the good things.
1 Renewables lifted their overall share of total NEM supply to 39% in Q1 2024, up from 37.4% the same time last year in Q1 2023.
2 Grid-scale solar increased 18% to 2,164MW compared to last year.
3 Distributed (domestic) PV was up 10% compared to last year.
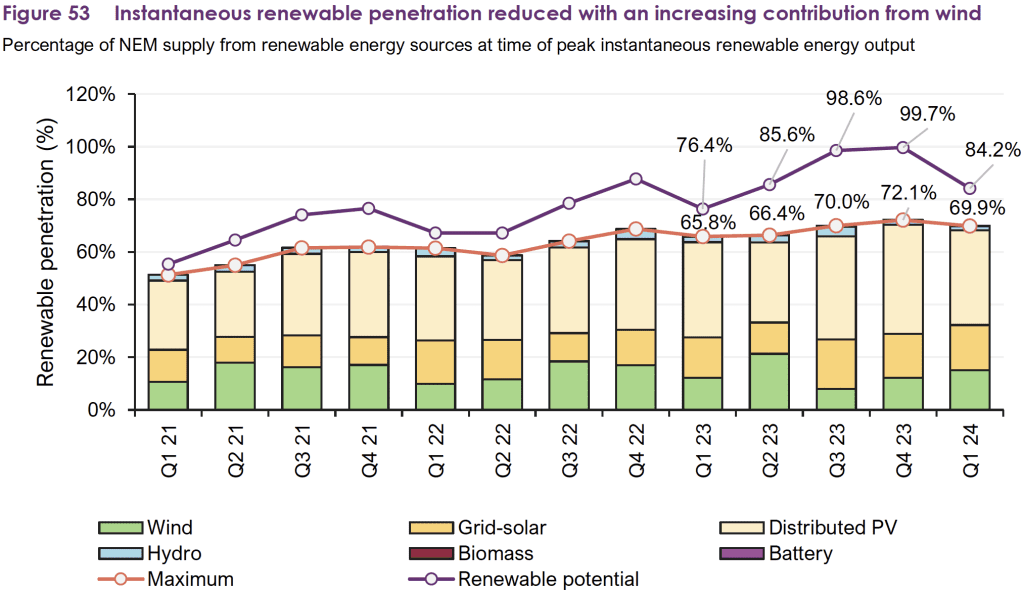
4 Instantaneous renewable penetration hit a record in Q4 2023 of 72.1% as shown in Figure 53 in the report.
5 NEM wholesale spot prices averaged $76/MWh over Q1 2024, an 8% decrease from Q1 2023.
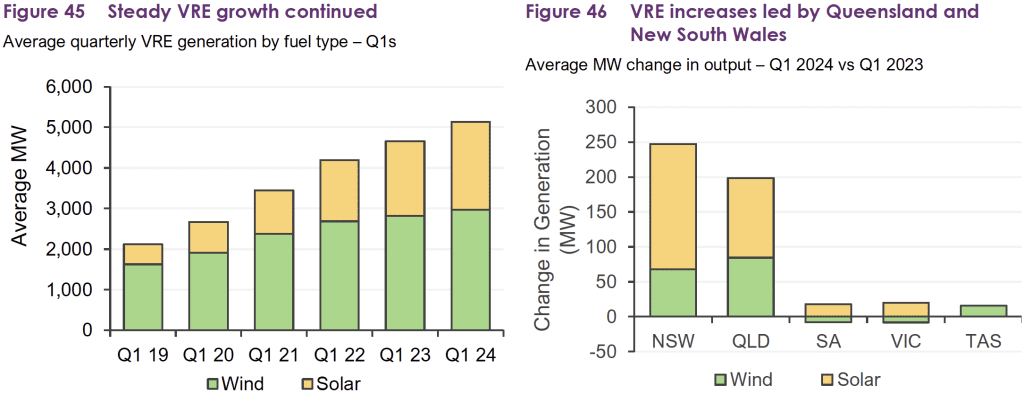
6 Renewables growth was steady, with wind and solar exceeding 5,000MW capacity, led by strong increases in Queensland and NSW as shown in Figures 45 and 46 opposite.
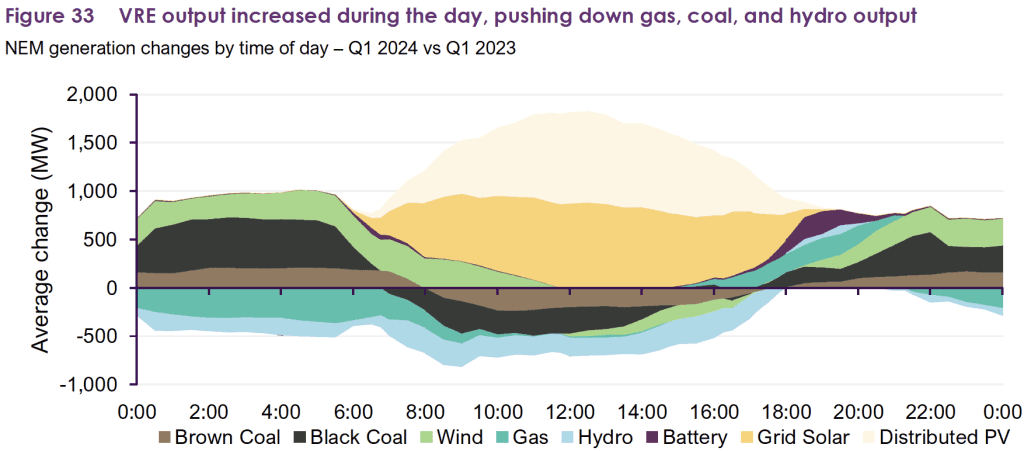
7 As we can see in Figure 33, solar continued to take a huge chunk out of fossil fuel generation during the day, showing a growing “duck curve”. (Find out more about the duck curve from our CEO.)
And now for the bad things.
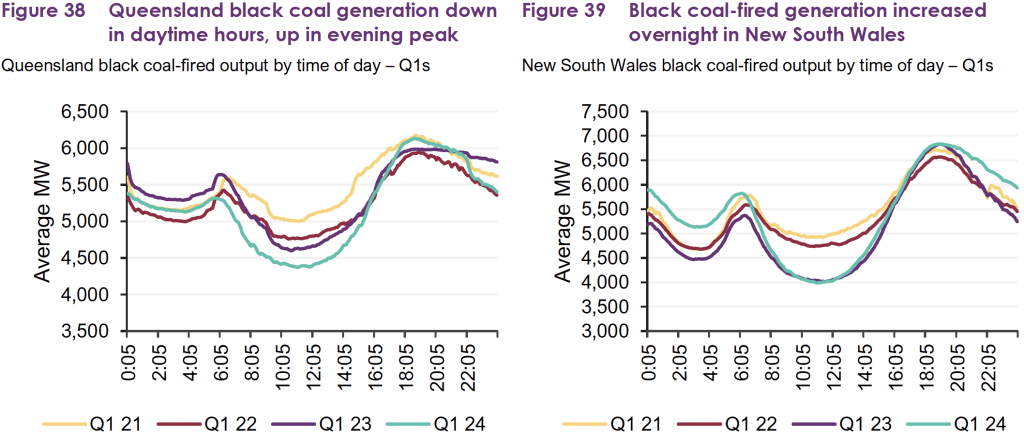
1 The evening peak demand keeps on getting bigger thanks to hotter weather, which means fossil fuel generation needed to increase at night. This increases average black-coal-fired generation for the quarter by 1.1% to 10,613MW and brown-coal-fired generation by 0.6% to 3,675MW, shown opposite.
2 Queensland recorded an increase in wholesale spot prices at $118/MWh, up 13% from Q1 2023 and 75% from Q4 2023.
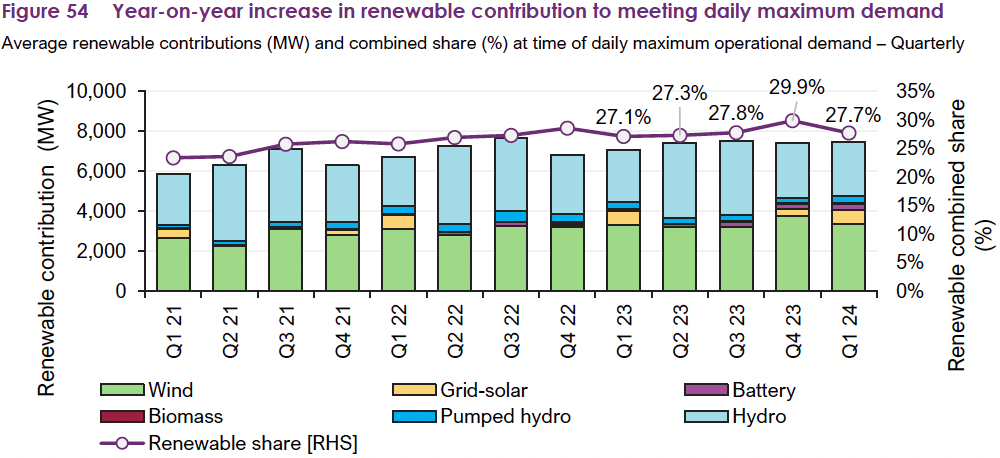
3 While renewables hit a record contribution to maximum demand, solar is virtually zero in the peak evening period, meaning that solar’s overall contribution is only 27.7% of daily maximum demand.
These results show how far we have to go to achieve net zero.
However, there are some silver linings to the growing duck curve and the need for renewables to feed into the NEM at night.
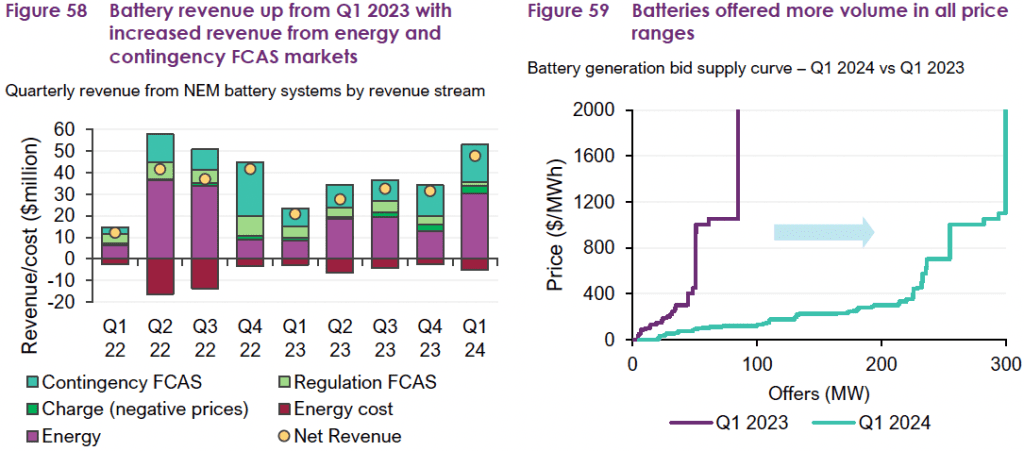
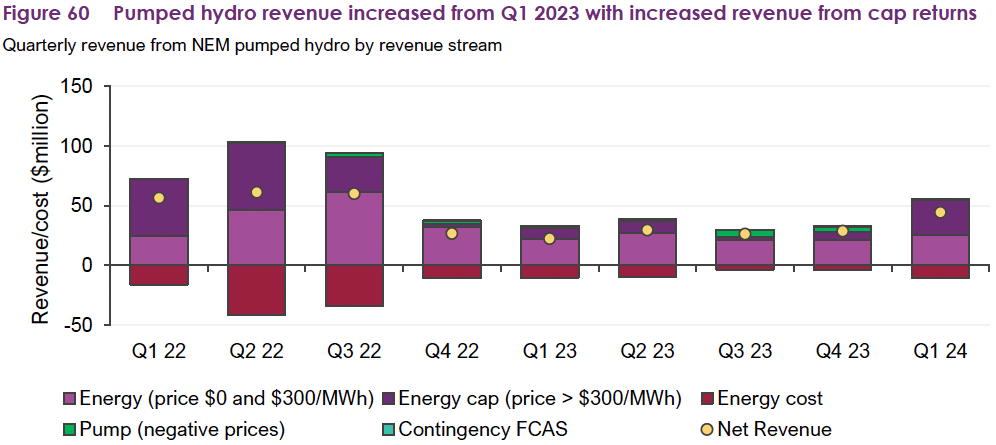
1 The growing storage and Frequency Control Ancillary Services (FCAS) markets are providing excellent revenues to pumped hydro and battery storage projects, with a growth of 74% in quarterly average battery capacity from 947MW in Q1 2023 to 1,652MW this quarter.
2 A 134% year-on-year increase in quarterly average battery generation, from 23MW in Q1 2023 to 53MW this quarter, as shown in Figures 58, 59 and 60 below.
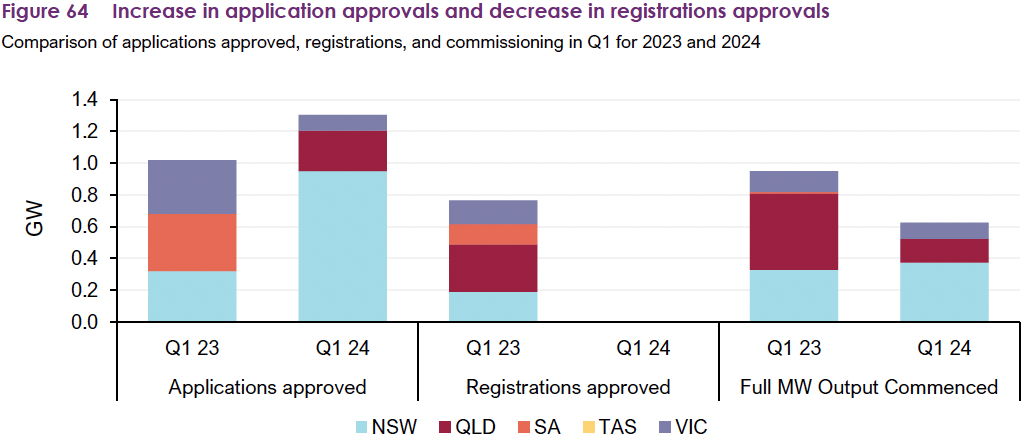
However, possibly the most concerning result this quarter was, despite the clear and urgent need for more renewables, especially in storage and wind, is the complete lack of new projects registered in the NEM.
Inexplicably, despite an increase of new connection applications, the number of projects successfully registered to connect has dropped to zero (Figure 64).
This is a very troubling result. Far more needs to be done to facilitate Australia's energy transition to succeed.
Click below to explore our services in the relevant areas.
Data centre demand is growing fast and could account for up to 11% of Australia’s electricity consumption by 2035. This boom is good for the economy as it is expected to attract around $85 to $135 billion in investment, but...
I was lucky enough to attend the Suriname Energy, Oil and Gas Summit (SEOGs) in Paramaribo in June. This is some of what I learnt. Focus on the people of...